As initially presented when describing the safety analysis metamodel, ATICA allows to refine the failure representations across the different layers of the systems engineering process (System Analysis, Logical Architecture, Physical Architecture) maintaining traceability and ensuring consistency along the product life cycle.
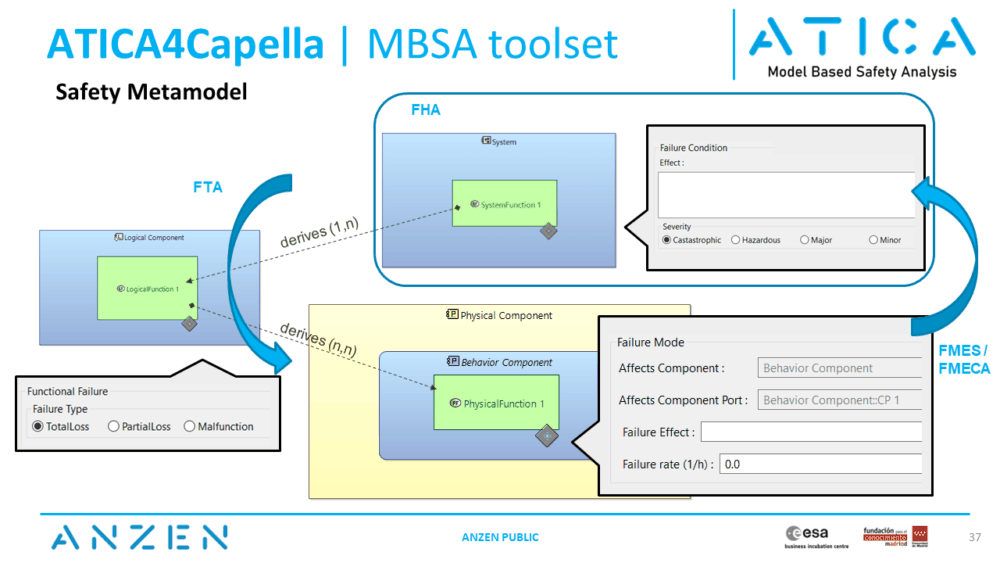
The Failure Modes and Effects Analysis (FMEA) allows to describe the safety and dependability related data at the physical layer, linked to the implementation of the system. The results can also be summarized and abstracted out to logical and system layers using the Failure Modes and Effects Summary (FMES) dashboard.
Physical Architecture Layer
At the Physical Architecture layer, the Failure Modes can be created and associated to Behavior Components. This can be done from a System Architecture Blank, from the project explorer (right click on the MBSA Package and add New Capella Element); or from a FMEA dahsboard.
The FMEA dashboard is linked to a Behavior Component, and will summarize all failures of this component and all other Behavior Components embedded into it. In order to create the dashboard, from the project explorer (left hand side), righ click on any component, New Diagram/Table.../[MBSA] Failure Modes and Effects Analysis (FMEA).
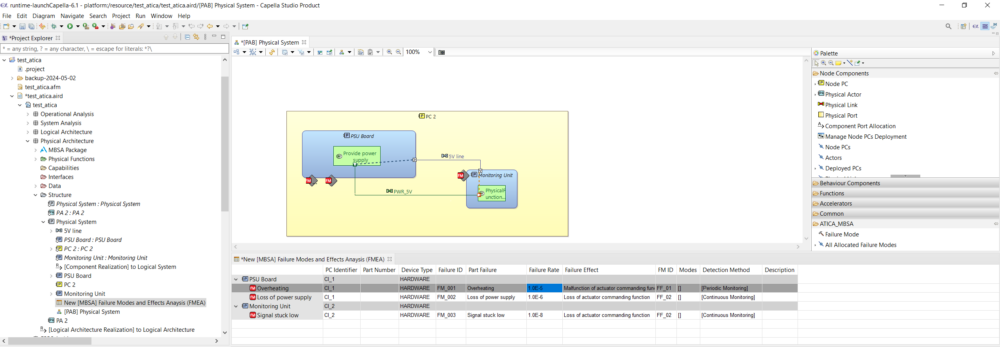
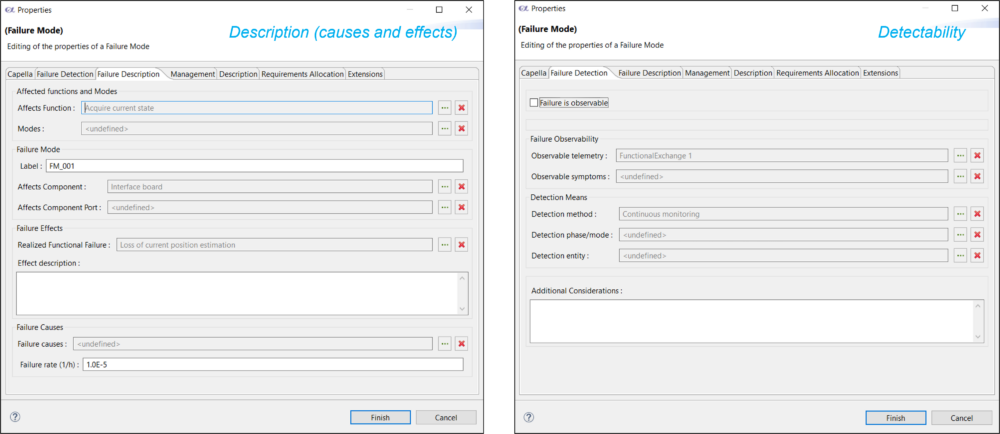
The failure attributes can be modified directly from the dashboard or using the contextual menus of each Failure Mode individually (double click on the Failure Mode in the project explorer on the left hand side).
The FMEA dashboard allows direct creation of additional failure modes just by right click on the corresponding parent component, Create New Failure Mode. The newly created failure will be automatically linked to that component.
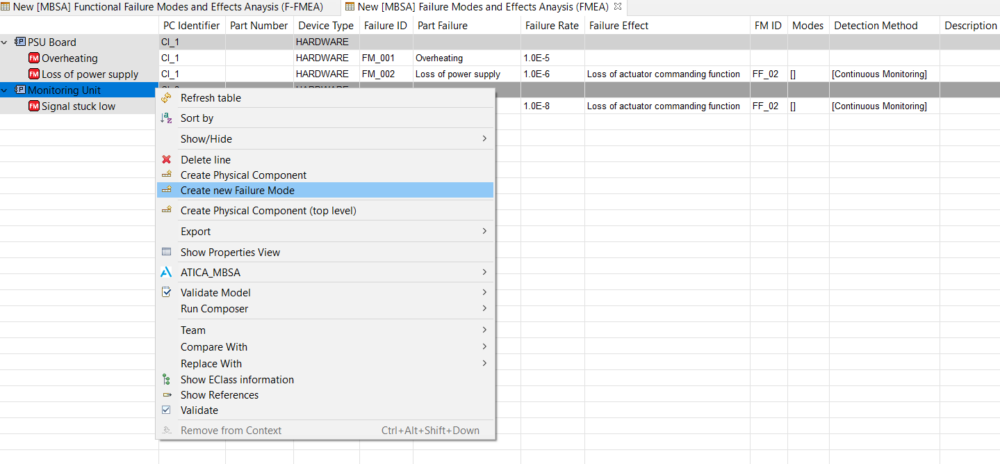
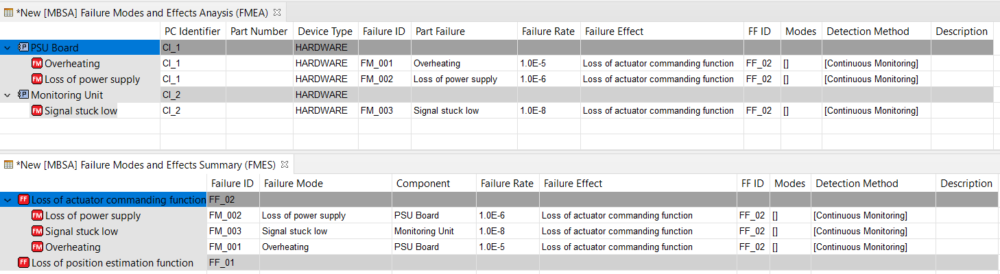
The FMEA presents the failure items organized by components. A summary of all the failure modes organized by its effects is presented in the FMES dashboard. This dashboard can be created directly from the MBSA Package object at the physical layer (right click, Create New Diagram / Table...), and will present all Failure Modes organized by their corresponding Functional Failure which summarizes their effect at the immediate superior layer (Logical Architecture).
Logical Architecture Layer
The Functional FMEA (F-FMEA) dashboard provides at the Logical Architecture Layer a very similar functionality to the FMEA at the Physical Layer. In this case the lines represent Functional Failures, and the hierarchy of the table is organized by Logical Functions. Similarly to the FMEA, the effects column reports the corresponding failure element at the immediate superior layer, in this case the Failure Conditions at the System Analysis layer.

The F-FMEA could be enabled from any Logical Function (righ click on the function from the project explorer on the righ hand side, and select New Diagram / Table...) and will report all Functional Failures corresponding to this function and all its children functions. New Functional Failures can be created directly from the table by righ click on their corresponding parent function.
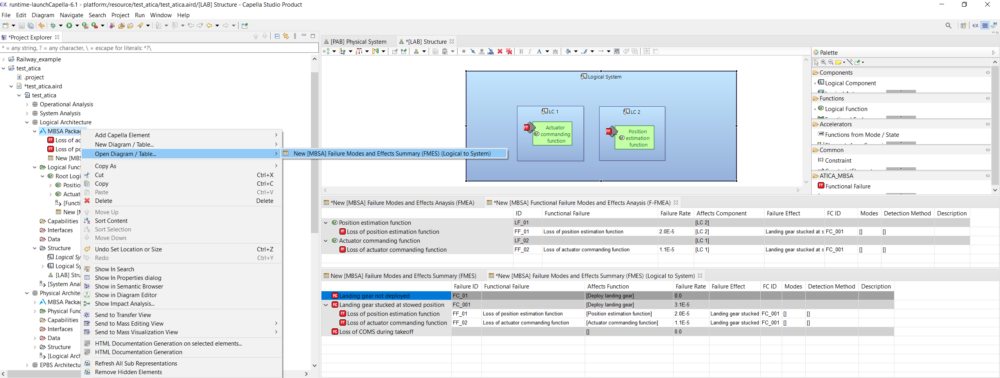
A Failure Modes and Effects Summary (FMES) is also available at Logical level to summarize the main effects at System level of the failures defined at Logical level. To enable this dashboard, right click on the MBSA Package at Logical Architecture level and select New Diagram / Table... / [MBSA] Failure Modes and Effects Summary (FMES) (Logical to System).
Contact
For additional info or to request a demo, please get in touch.